Written by: Ying Zhu
Introduction
In this article, we’ll showcase how we identified and addressed a service mesh performance problem at Airbnb, providing insights into the process of troubleshooting service mesh issues.
Background
At Airbnb, we use a microservices architecture, which requires efficient communication between services. Initially, we developed a homegrown service discovery system called Smartstack exactly for this purpose. As the company grew, however, we encountered scalability issues¹. To address this, in 2019, we invested in a modern service mesh solution called AirMesh, built on the open-source Istio software. Currently, over 90% of our production traffic has been migrated to AirMesh, with plans to complete the migration by 2023.
The Symptom: Increased Propagation Delay
After we upgraded Istio from 1.11 to 1.12, we noticed a puzzling increase in the propagation delay — the time between when the Istio control plane gets notified of a change event and when the change is processed and pushed to a workload. This delay is important for our service owners because they depend on it to make critical routing decisions. For example, servers need to have a graceful shutdown period longer than the propagation delay, otherwise clients can send requests to already-shut-down server workloads and get 503 errors.
Data Gathering: Propagation Delay Metrics
Here’s how we discovered the condition: we had been monitoring the Istio metric pilot_proxy_convergence_time for propagation delay when we noticed an increase from 1.5 seconds (p90 in Istio 1.11) to 4.5 seconds (p90 in Istio 1.12). Pilot_proxy_convergence_time is one of several metrics Istio records for propagation delay. The complete list of metrics is:
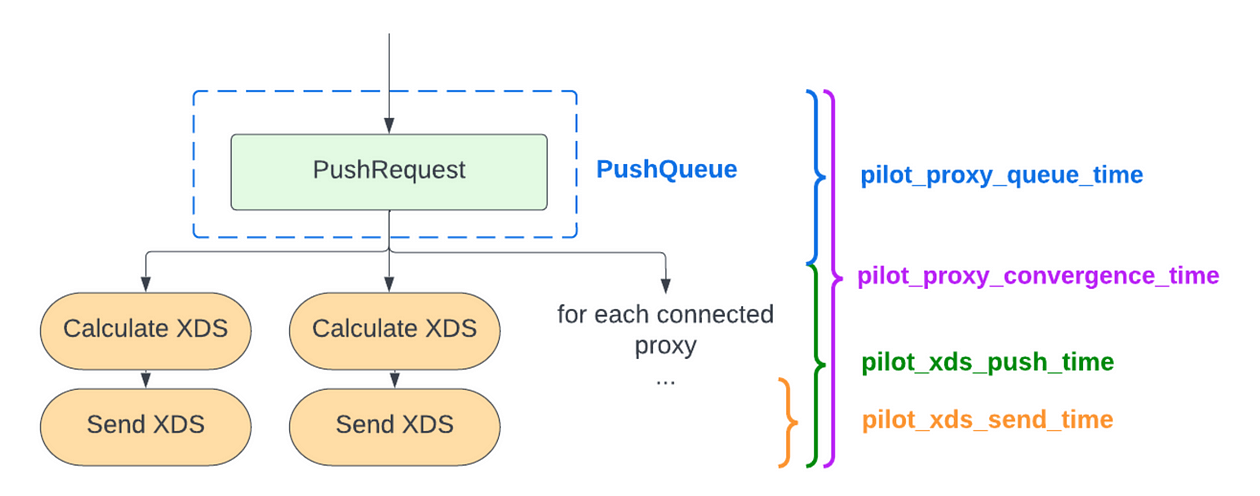
- pilot_proxy_convergence_time — measures the time from when a push request is added to the push queue to when it is processed and pushed to a workload proxy. (Note that change events are converted into push requests and are batched through a process called debounce before being added to the queue, which we will go into details later.)
- pilot_proxy_queue_time — measures the time between a push request enqueue and dequeue.
- pilot_xds_push_time — measures the time for building and sending the xDS resources. Istio leverages Envoy as its data plane. Istiod, the control plane of Istio, configures Envoy through the xDS API (where x can be viewed as a variable, and DS stands for discovery service).
- pilot_xds_send_time — measures the time for actually sending the xDS resources.
The diagram below shows how each of these metrics maps to the life of a push request.

Investigation
xDS Lock Contention
CPU profiling showed no noticeable changes between 1.11 and 1.12, but handling push requests took longer, indicating time was spent on some waiting events. This led to the suspicion of lock contention issues.
Istio uses four types of xDS resources to configure Envoy:
- Endpoint Discovery Service (EDS) — describes how to discover members of an upstream cluster.
- Cluster Discovery Service (CDS) — describes how to discover upstream clusters used during routing.
- Route Discovery Service (RDS) –describes how to discover the route configuration for an HTTP connection manager filter at runtime.
- Listener Discovery Service (LDS) –describes how to discover the listeners at runtime.
Analysis of the metric pilot_xds_push_time showed that only three types of pushes (EDS, CDS, RDS) increased after the upgrade to 1.12. The Istio changelog revealed that CDS and RDS caching was added in 1.12.
To verify that these changes were indeed the culprits, we tried turning off the caches by setting PILOT_ENABLE_CDS_CACHE and PILOT_ENABLE_RDS_CACHE to “False”. When we did this, pilot_xds_push_time for CDS reverted back to the 1.11 level, but not RDS or EDS. This improved the pilot_proxy_convergence_time, but not enough to return it to the previous level. We believed that there was something else affecting the results.
Further investigation into the xDS cache revealed that all xDS computations shared one cache. The tricky thing is that Istio used an LRU Cache under the hood. The cache is locked not only on writes, but also on reads, because when you read from the cache, you need to promote the item to most recently used. This caused lock contention and slow processing due to multiple threads trying to access the same lock at the same time.
The hypothesis formed was that xDS cache lock contention caused slowdowns for CDS and RDS because caching was turned on for those two resources, and also impacted EDS due to the shared cache, but not LDS as it did not have caching implemented.
But why turning off both CDS and RDS cache does not solve the problem? By looking at where the cache was used when building RDS, we found out that the flag PILOT_ENABLE_RDS_CACHE was not respected. We fixed that bug and conducted performance testing in our test mesh to verify our hypothesis with the following setup:
- Control plane:
– 1 Istiod pod (memory 26 G, cpu 10 cores) - Data plane:
– 50 services and 500 pods
– We mimicked changes by restarting deployments randomly every 10 seconds and changing virtual service routings randomly every 5 seconds
Here were the results:

Because our Istiod pods were not CPU intensive, we decided to disable the CDS and RDS caches for the moment. As a result, propagation delays returned to the previous level. Here is the Istio issue for this problem and potential future improvement of the xDS cache.
Debounce
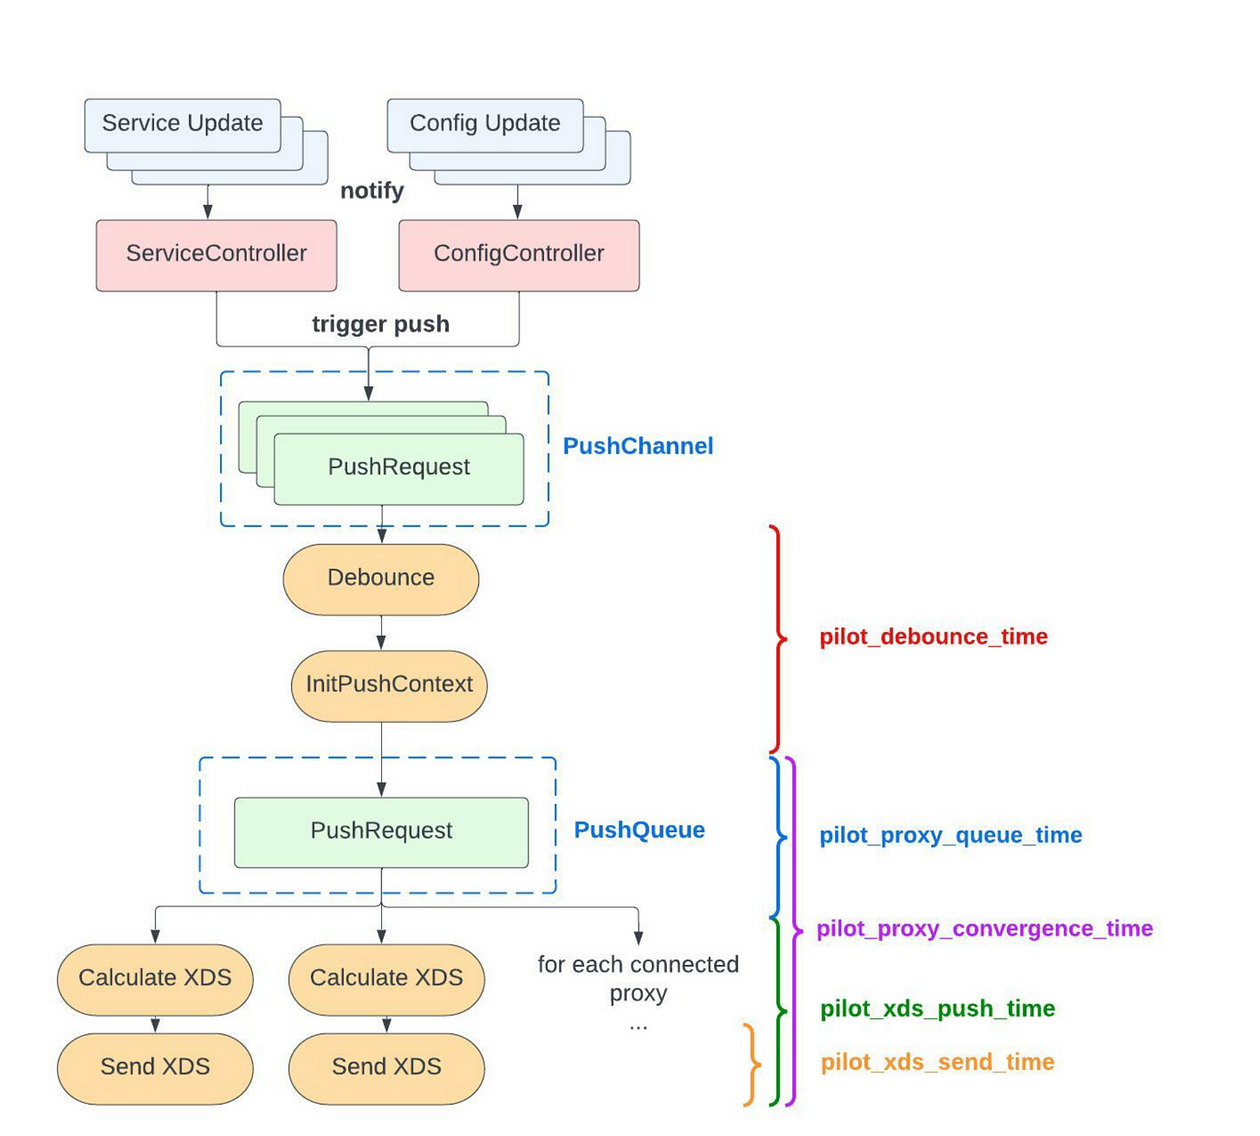
Here’s a twist in our diagnosis: during the deep dive of Istio code base, we realized that pilot_proxy_convergence_time does not actually fully capture propagation delay. We observed in our production that 503 errors happen during server deployment even when we set graceful shutdown time longer than pilot_proxy_convergence_time. This metric does not accurately reflect what we want it to reflect and we need to redefine it. Let’s revisit our network diagram, zoomed out to include the debounce process to capture the full life of a change event.

The process starts when a change notifies an Istiod controller³. This triggers a push which is sent to the push channel. Istiod then groups these changes together into one combined push request through a process called debouncing. Next, Istiod calculates the push context which contains all the necessary information for generating xDS. The push request together with the context are then added to the push queue. Here’s the problem: pilot_proxy_convergence_time only measures the time from when the combined push is added to the push queue, to when a proxy receives the calculated xDS.
From Istiod logs we found out that the debounce time was almost 110 seconds, even though we set PILOT_DEBOUNCE_MAX to 30 seconds. From reading the code, we realized that the initPushContext step was blocking the next debounce to ensure that older changes are processed first.
To debug and test changes, we needed a testing environment. However, it was difficult to generate the same load on our test environment. Fortunately, the debounce and init push context are not affected by the number of Istio proxies. We set up a development box in production with no connected proxies and ran custom images to triage and test out fixes.
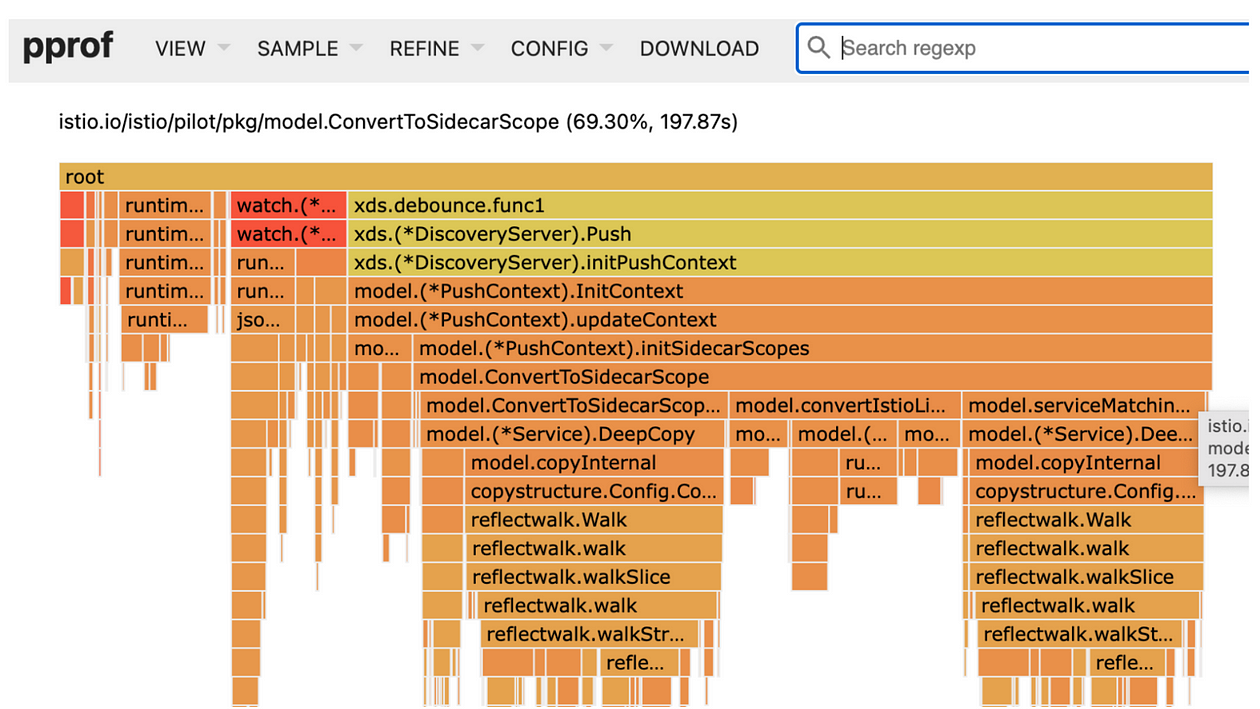
We performed CPU profiling and took a closer look into functions that were taking a long time:

A significant amount of time was spent on the Service DeepCopy function. This was due to the use of the copystructure library that used go reflection to do deep copy, which has expensive performance. Removing the library⁴ was both easy and very effective at reducing our debounce time from 110 seconds to 50 seconds.

After the DeepCopy improvement, the next big chunk from the cpu profile was the ConvertToSidecarScope function. This function took a long time to determine which virtual services were imported by each Istio proxy. For each proxy egress host, Istiod first computed all the virtual services exported to the proxy’s namespace, then selected the virtual services by matching proxy egress host name to the virtual services’ hosts.
All our virtual services were public as we did not specify the exportTo parameter, which is a list of namespaces to which this virtual service is exported. If this parameter is not configured, the virtual service is automatically exported to all namespaces. Therefore, VirtualServicesForGateway function created and copied all virtual services each time. This deep-copy of slice elements was very expensive when we had many proxies with multiple egress hosts.
We reduced the unnecessary copy of virtual services: instead of passing a copied version of the virtual services, we passed the virtualServiceIndex directly into the select function, further reducing the debounce time from 50 seconds to around 30 seconds.
Another improvement that we are currently rolling out is to limit where virtual services are exported by setting the exportTo field, based on which clients are allowed to access the services. This should reduce debounce time by about 10 seconds.
The Istio community is also actively working on improving the push context calculation. Some ideas include adding multiple workers to compute the sidecar scope, processing changed sidecars only instead of rebuilding the entire sidecar scope. We also added metrics for the debounce time so that we can monitor this together with the proxy convergence time to track accurate propagation delay.
Conclusion
To conclude our diagnosis, we learned that:
- We should use both pilot_debounce_time and pilot_proxy_convergence_time to track propagation delay.
- xDS cache can help with CPU usage but can impact propagation delay due to lock contention, tune PILOT_ENABLE_CDS_CACHE & PILOT_ENABLE_RDS_CACHE to see what’s best for your system.
- Restrict the visibility of your Istio manifests by setting the exportTo field.
If this type of work interests you, check out some of our related roles!
Acknowledgments
Thanks to the Istio community for creating a great open source project and for collaborating with us to make it even better. Also call out to the whole AirMesh team for building, maintaining and improving the service mesh layer at Airbnb. Thanks to Lauren Mackevich, Mark Giangreco and Surashree Kulkarni for editing the post.
[1]: Checkout our presentation Airbnb on Istio for details.
[2]: Note that some CPU throttling occurred for the last two cases, so if we were to allocate more CPU we would expect propagation delay (especially P99) to improve further.
[3]: Istiod service controller monitors changes to registered services from different sources including kubernetes service, ServiceEntry created service, etc., Istiod config controller monitors changes to the Istio resources used to manage those services.


