How we built a storage system that ingests 50 million samples per second and stores 2.5 petabytes of logical time series data.
By: Rishabh Kumar
Modern observability practice encourages instrumenting every meaningful code path. Over the past 15 years, open-source observability SDKs like Prometheus, OpenTelemetry, and StatsD have made deep instrumentation nearly ubiquitous. These days, most software — open-source or custom — can be made observable by default, assuming you actually collect the data.
Airbnb is no exception. As our products and infrastructure have evolved, each new feature and each new incident has added another layer of instrumentation. Unsurprisingly, we were generating 1.3 billion active time series on average, at 50 million samples every second.
When we made the decision to move from a hosted metrics provider to an internally operated solution, the sheer scale introduced a set of engineering challenges. Our initial mandate was straightforward in principle but challenging in practice: persisting and serving this data performantly.
This blog post walks through several of the key challenges we encountered while building a system capable of operating at this speed and this scale.
Navigating tenancy
Isolating read and writes
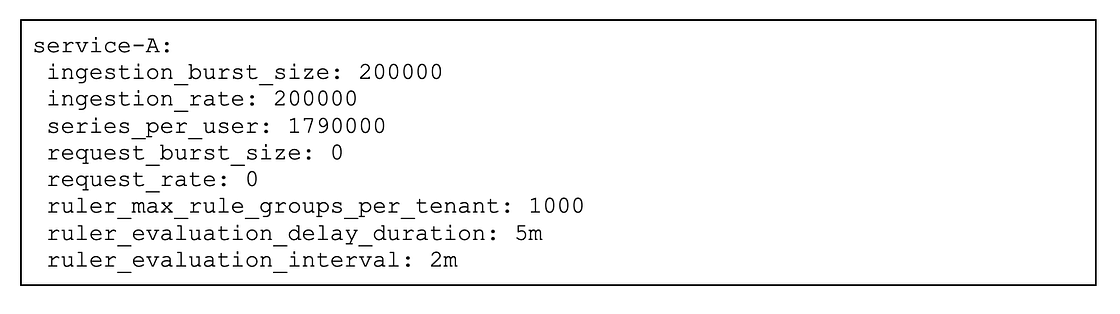
There were several possible approaches for organizing tenants. We considered mapping tenants by team, but this was discarded because team ownership of applications changes frequently. With roughly 1,000 services at Airbnb, assigning a tenant to each service or process offered a more logical and stable grouping. This approach enables precise attribution of metric growth to individual applications and also lays the groundwork for future chargeback mechanisms. Key write and read guardrails were established per application, e.g. the amount/rate of metrics ingested, total number of rules, evaluation interval/offset etc.
Shuffle sharding
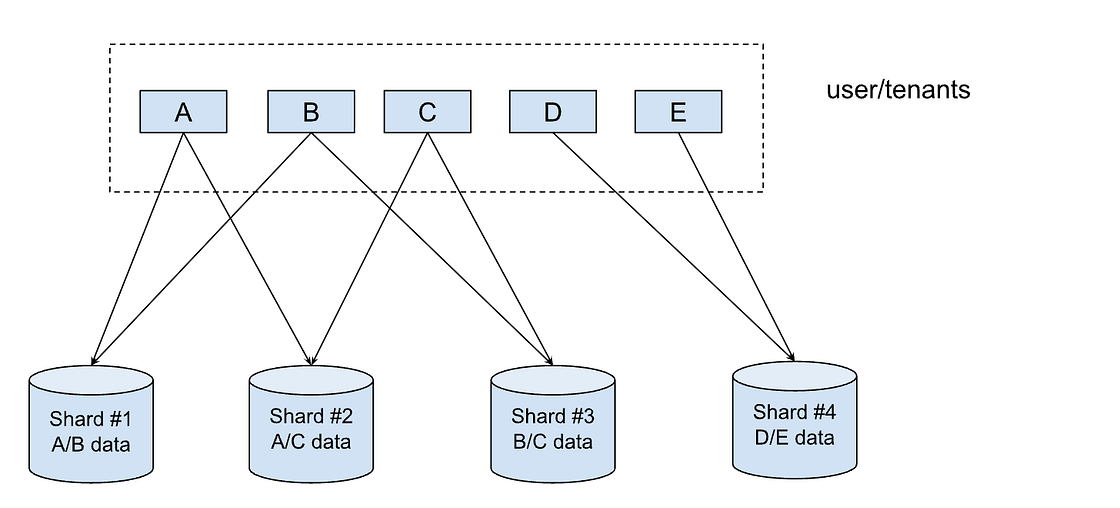
Shuffle sharding is a technique that isolates different tenants’ workloads and gives each tenant a single-tenant experience in a shared cluster. This improves fault tolerance and isolates failures for both read and writes in scenarios such as node outages. When incoming metrics data is received, shuffle sharding ensures that each tenant writes only to a subset of storage nodes. Similarly, when a query comes in via Grafana, shuffle sharding randomly selects a subset of query workers (the shuffled set). This ensures that no single tenant can overwhelm the entire query layer or fleet of ingesters. The diagram below illustrates that if there is a DDoS or other attack from application A, the first and second shards may go down, impacting B & C, but the data of other applications (D & E) are still preserved in the third and fourth shard.
Strategizing operational aspects
Shifting to a multi-tenant architecture forced us to handle multiple configurations per tenant, leading to significant operational complexity for the team. Key challenges which were identified:
- Tenant onboarding involved numerous manual steps across multiple components and required a series of code changes and deployments, often consuming a lot of time
- It was unclear which configuration parameters needed adjustment when a tenant approached or exceeded limits.
These challenges were solved with a consolidated control plane. New tenants were automatically onboarded by monitoring new services’ creation, and updates were automatic upon configuration changes, allowing a single deployment for any applicable changes. The second challenge was addressed by exposing only the necessary limits and deriving other limits; e.g., series limits were exposed, but ingestion rate/ingestion burst size was derived based on the series limit.
Observability at scale
Our initial effort to set out and research requirements identified challenges that our effort would have to meet. As a first step in meeting them, we took steps to ensure that we could run single clusters with a high degree of reliability.
Observability requirements and challenges
Our assessment of the existing vendor-based observability backend provided us with a clear understanding of the active time series volume and ingestion rates. As we set out to build a reliable and scalable metrics backend, some key requirements identified were:
- The system should be capable of handling over 50 million samples per second and 1.3 billion active timeseries.
- It should support up to 10,000 dashboards and 500,000 alerts, while maintaining a p99 query execution time under 30 seconds.
To validate these requirements, we deployed shadow clusters using production traffic. This surfaced a number of challenges:
- Reliability issues in both write and read components, primarily due to unpredictable demand (such as spikes in active timeseries) and the absence of robust query guardrails.
- Compaction, which optimizes long-term storage by merging small and fragmented time series data, incurred significant delays for large tenants. This adversely impacted query performance and resulted in excessive resource consumption when accessing historical data.
- Slow query performance when requests involve a large payload (e.g, more than 5,000 series or when 500MB+ data is being processed). The absolute number may vary depending on the querying system.
- Degraded observability across all tenants if the cluster experiences issues, resulting in significant risk of “flying blind” (reduced observability) for these tenants.
Addressing these challenges required a strategic shift: our first focus was to improve the reliability of a single cluster. Building on that, we are moving towards a multi-cluster architecture to establish multiple failure domains and minimize the blast radius of issues, thereby enhancing overall system resiliency.
Running a single cluster reliably
We started with stabilizing writes, followed by reads and compaction.
Writes: We started with benchmarking write components to figure out resource usage based on metrics ingested per second. This helped in capacity planning and component sizing and setting per-replica limits based on ingestion rate and inflight requests.
Write guardrails were set, starting with the maximum number of time series emitted for a tenant. We began with a one-month lookback period, which was continuously adjusted over time.
Reads and compaction: As compared to writes, benchmarking read components presented unique challenges due to query payload variability. We used query sharding to normalize the reads on query workers. Read guardrails, such as limits on the number of fetched series/chunks per query, were set on a per-tenant basis to ensure that a few bad queries would not cause outages. The evaluation query path was isolated from the ad hoc query (dashboards, continuous integration jobs) path due to varied criticality. Autoscaling was enabled for read components, allowing dynamic fleet scaling in response to variable throughput patterns throughout the day. For very large tenants, compaction workloads were sharded, with each worker processing up to eight million series, ensuring data being read is always compacted.
Both writes and reads had stateful components which were made zone-aware and were deployed in three zones to be more fault tolerant during a zonal outage, and less vulnerable to outages in events such as node rotation/deployments.
The outcome
Per-replica limits provided actionable scaling signals for fleet management. Tenant-level controls shielded the system from potentially disruptive behavior. Multi-zone deployments enhanced both fault tolerance and deployment agility. With reliable single-cluster deployment, the strategy was to move to a multi-cluster architecture to achieve a reduced blast radius and to gain flexibility to launch in different regions, which is covered in the next section.
Multi-cluster environment and federation
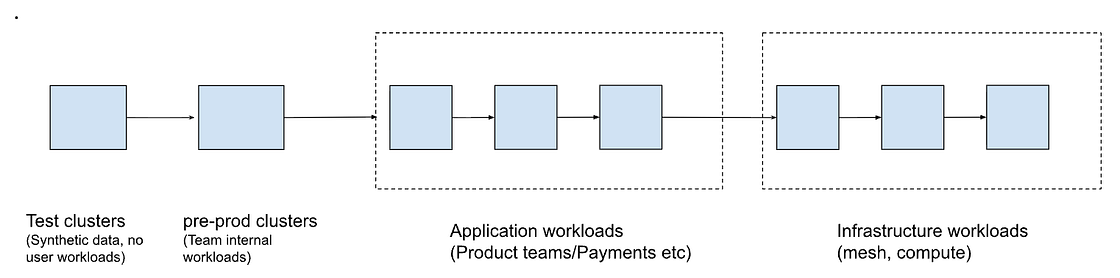
Due to blast radius and flexibility concerns, we adopted a multi-cluster architecture approach in which we distributed tenants across multiple clusters. Clusterization strategy involved creating dedicated clusters for specialized workloads (such as compute and mesh infrastructure) and multiple application clusters, ensuring that failures in one area did not affect others. Once multiple clusters were created and their respective workloads onboarded, we needed to establish a rollout strategy that followed a progressive approach: starting with test and internal clusters, advancing through application clusters, and finally deploying infrastructure clusters to achieve over 99.9% availability and high reliability. This ensured that workloads are sequenced based on criticality, as shown below:
However, there were multiple concerns which came up as part of adopting a multi-cluster architecture:
- Complex metrics discovery and querying: Metrics discovery became increasingly challenging as we introduced the additional complexity of routing reads to the correct cluster, on top of supporting multiple tenants. Many use cases required joining application metrics with host or client metrics, which were sometimes attributed to various clusters, making querying technically demanding.
- Operational overhead: Managing numerous clusters meant higher operational complexity, with more resources needed for configuration, maintenance, and monitoring.
We addressed these concerns by building tooling to manage tenant cluster mapping, which was a source of truth for all the components that needed cluster-level awareness. Deployment of stateful apps was automated using Grafana Kubernetes OSS roll-out operators, enabling coordinated, multi-AZ rollouts across StatefulSets within a namespace. This replaced a manual, sequential process that took days, and also reduced configuration drift across clusters. Seamless deployment also helped in reducing configuration drift across clusters.
We leveraged the Promxy OSS project, which is a proxy over Prometheus, and added some custom functionality such as native histogram support and. query fanout optimization. These enhancements enable cross-cluster querying and alerting, tailored to Airbnb’s needs.
Key learnings
Moving to a multi-cluster architecture, along with seamless deployment strategies, have been instrumental in addressing blast radius concerns and ensuring platform resilience. Below are selected key learnings, some of which we discovered as we started adopting a multi-cluster approach, and some which we discovered later through varied query patterns from customers:
- Cross-cluster querying cost: Federated queries are significantly more resource-intensive, typically 5–10x costlier than queries within a single cluster. We encountered multiple scenarios in which a few sets of expensive queries were enough to cause read reliability issues across multiple clusters. This experience led us to adjust aspects of tenant consolidation, particularly in relation to hot read patterns.
- Deployment consistency: When using a single-cluster approach, stateful apps were deployed manually, which was operationally intensive as we steered toward multi-cluster deployments. We spent a good deal of time in making OSS Kubernetes rollout operators compatible with Airbnb cloud infra, which involves respecting strict pod disruption budget requirements while rollouts and other node operations are happening. We use automation and standardized deployments, which help to prevent configuration drift and maintain reliability.
- Cluster management philosophy: Our single-cluster scaling and stabilization work enabled clusters to self-tune. This approach allowed us to add or replace clusters with minimal additional operational overhead, effectively allowing us to treat clusters as cattle, not pets.
Conclusion
Building a reliable, large-scale observability platform at Airbnb has been as much about architecture and operations as it has been about culture and expectations. We began with a straightforward mandate: persist and serve billions of time series at high throughput. We quickly discovered that true reliability required us to rethink tenancy, failure domains, and dependencies end-to-end.
The work is ongoing. We’re actively exploring ways to further reduce metric volume, optimize cross-cluster querying, and simplify the developer experience, while continuing to scale with Airbnb’s growth. But the principles we’ve leaned on — isolation, automation, guardrails, and independent paths for critical signals — will continue to guide how we evolve the system.
Ultimately, observability at scale is not just about having the most advanced tools or sophisticated dashboards. It’s about designing scalable systems that can clearly communicate what they are doing, why they are doing it, and when something goes wrong. It establishes a continuous feedback loop between systems and teams, empowering rapid learning and ongoing improvement, enabling us to uphold our responsibility to guests and Hosts around the world.
Does this type of work interest you? Check out our open roles.
Acknowledgments
Thank you to the Observability team — Abdurrahman Allawala, Callum Jones, Eugene Ma, Natasha Aleksandrova, Rong Hu, Wei Song, and Yann Ramin— who helped in building this storage system. We would also like to thank the Cloud Infrastructure, Cost, and other partner teams for their invaluable collaboration throughout this project.
We also want to thank Suman Karumuri and Xuan Lu for their support in authoring this post during their time at Airbnb.
All product names, logos, and brands are property of their respective owners. All company, product, and service names used in this website are for identification purposes only. Use of these names, logos, and brands does not imply endorsement.